How to Plot Acid-Base Titration Curves with Sakura Chart
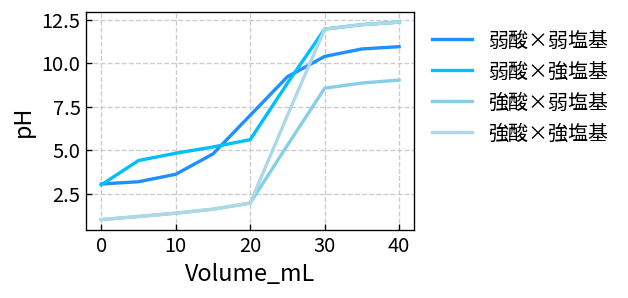
This guide shows how to plot pH against titrant volume with Sakura Chart. We compare four combinations—strong acid/strong base, weak acid/strong base, strong acid/weak base, and weak acid/weak base— in a single chart, using a LEVEL column to color the curves.
Titration curves are common in high-school and university chemistry. With the sample table below, you can create all four curves at once without rebuilding the chart manually in a spreadsheet.
What You Will Learn
- How to organize pH and titrant-volume data in one CSV table
- How to plot four acid-base combinations on the same chart
- How equivalence-point pH differs among the four combinations
- How to prepare a clear figure for a class, report, or teaching material
Assumptions Used in the Sample Data
The values below are model data adjusted to illustrate typical curve shapes, not experimental measurements. The assumed conditions are:
- Initial analyte volume: 25 mL
- Analyte concentration: 0.10 mol/L
- Titrant concentration: 0.10 mol/L
- X-axis: titrant volume (mL)
- Y-axis: pH
- LEVEL: acid-base combination
| Type (LEVEL) | Example | Behavior near equivalence |
|---|---|---|
| Strong acid + strong base | HCl titrated with NaOH | Passes steeply through about pH 7 |
| Weak acid + strong base | Acetic acid titrated with NaOH | Equivalence point above pH 7 |
| Strong acid + weak base | HCl titrated with aqueous NH3 | Equivalence point below pH 7 |
| Weak acid + weak base | General weak-acid/weak-base case | A more gradual overall change |
Sample Data (CSV: X, Y, LEVEL)
Volume_mL: titrant volume, used for the X-axispH: solution pH, used for the Y-axisType: titration type, used as the LEVEL column
Copy the CSV below and paste it into Sakura Chart.
Volume_mL,pH,Type
0,1.00,Strong acid + strong base
0,3.00,Weak acid + strong base
0,1.00,Strong acid + weak base
0,3.05,Weak acid + weak base
5,1.18,Strong acid + strong base
5,4.40,Weak acid + strong base
5,1.18,Strong acid + weak base
5,3.18,Weak acid + weak base
10,1.37,Strong acid + strong base
10,4.82,Weak acid + strong base
10,1.37,Strong acid + weak base
10,3.61,Weak acid + weak base
15,1.60,Strong acid + strong base
15,5.18,Weak acid + strong base
15,1.60,Strong acid + weak base
15,4.78,Weak acid + weak base
20,1.95,Strong acid + strong base
20,5.60,Weak acid + strong base
20,1.95,Strong acid + weak base
20,7.00,Weak acid + weak base
25,7.00,Strong acid + strong base
25,8.85,Weak acid + strong base
25,5.28,Strong acid + weak base
25,9.22,Weak acid + weak base
30,11.96,Strong acid + strong base
30,11.96,Weak acid + strong base
30,8.56,Strong acid + weak base
30,10.39,Weak acid + weak base
35,12.22,Strong acid + strong base
35,12.22,Weak acid + strong base
35,8.86,Strong acid + weak base
35,10.82,Weak acid + weak base
40,12.36,Strong acid + strong base
40,12.36,Weak acid + strong base
40,9.03,Strong acid + weak base
40,10.95,Weak acid + weak base
Replace these model values with your experimental measurements to use the same workflow for a laboratory report.
How to Create the Titration Curves
1. Paste the Data
Paste the CSV into the data-entry area on Sakura Chart.
2. Select the Columns
- X-axis:
Volume_mL - Y-axis:
pH - LEVEL:
Type
Selecting Type as LEVEL automatically gives the four titration curves different colors.
3. Choose a Chart Type
A scatter plot can show the individual measurements, but a line chart makes the curve and the sharp change near equivalence easier to see.
Comparing the Four Curves
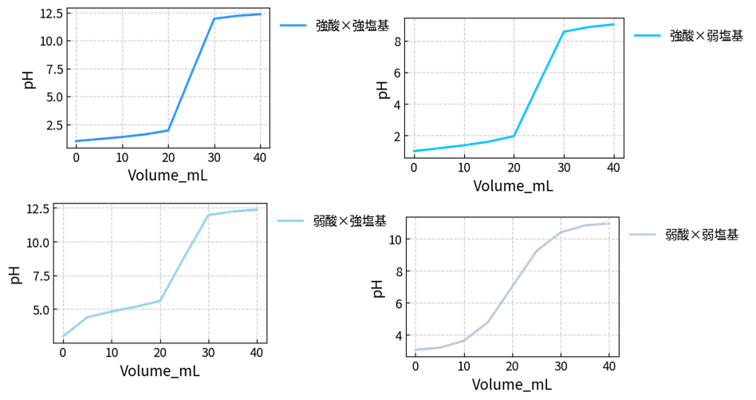
Strong Acid + Strong Base: The Classic S-Curve
For HCl titrated with NaOH, pH changes sharply near the equivalence point—25 mL in this model—and passes through approximately pH 7.
Weak Acid + Strong Base: Equivalence Above pH 7
When acetic acid is titrated with NaOH, the solution acts as a buffer before equivalence. The conjugate base present at equivalence makes the pH greater than 7.
Strong Acid + Weak Base: Equivalence Below pH 7
For a strong acid titrated with a weak base such as aqueous ammonia, the solution remains on the acidic side at equivalence, so the pH is below 7.
Weak Acid + Weak Base: A More Gradual Change
A weak-acid/weak-base combination produces a less pronounced change. In practice, this can make the equivalence point harder to identify and complicate indicator selection.
Ideas for Classes and Reports
- Paste the sample data during a lesson to demonstrate how each curve changes.
- Plot experimental and model data together for comparison in a report.
- Use LEVEL for indicator types to compare their transition ranges.
- Reuse the same CSV in Excel or another analysis tool.
Summary
- One CSV can contain titrant volume, pH, and a LEVEL identifying the acid-base combination.
- Four titration curves can be compared in one color-coded chart.
- The differences around the equivalence point become clear at a glance.
- Sakura Chart can quickly produce figures for classes, reports, and teaching materials.