Creating Coordinate Art with Sakura Chart: Cherry Blossoms and a Dog
Can a chart become a drawing? In this article, we use X and Y coordinates plus a LEVEL column to create pictures in Sakura Chart. First, we build a cherry blossom from simple geometry. Then we try the same idea with a dog—and discover why natural subjects are much harder to reduce to coordinates.
Part 1: Drawing a Cherry Blossom with Coordinates
A cherry blossom is a good subject for coordinate art because its shape can be described with symmetry and rotation. We create one petal from line segments, reflect it across the Y-axis, and rotate the finished petal five times. The same method also works in Excel, Python with Matplotlib, or any tool that plots coordinates.
What You Will Learn
- How to outline a petal with X-Y coordinates and four straight lines
- How reflection across the Y-axis creates a symmetrical shape
- How to rotate a shape with a rotation matrix
- How a LEVEL column can separate and color the five petals
Our First Attempt: Asking ChatGPT for Coordinates
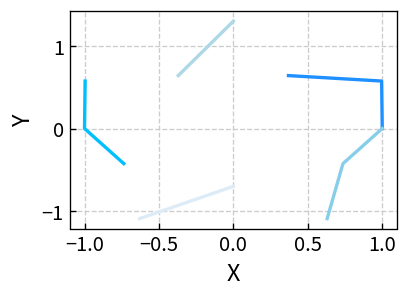
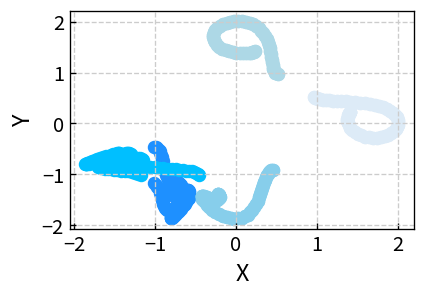
We first asked ChatGPT to generate coordinates that would look like a cherry blossom. The points appeared scattered when plotted, and even connecting them as a line chart did not produce a convincing flower. Converting a reference image directly into coordinates did not solve the problem either, so we decided to define the petal ourselves.
Step 1: Build Half a Petal from Four Lines
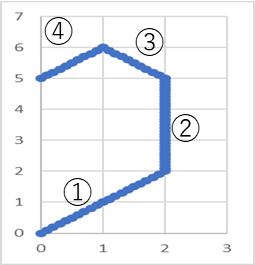
Because the petal is symmetrical, we only need to define one side first. We used these four segments:
1. Y = Xfor0 ≤ X ≤ 22. X = 2for2 ≤ Y ≤ 53. Y = -X + 7for1 ≤ X ≤ 24. Y = X + 5for0 ≤ X ≤ 1
Connecting the segments in order creates one side of the petal.
Step 2: Reflect the Shape Across the Y-Axis
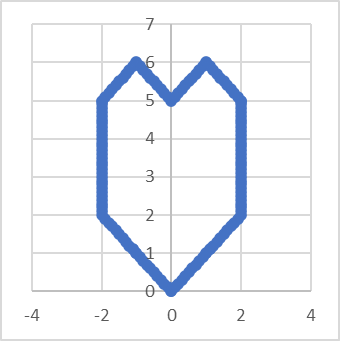
To complete one petal, duplicate each point and reverse the sign of its X coordinate. This is equivalent to using
Y = f(-X) and creates a mirror image across the Y-axis.
Step 3: Rotate the Petal Five Times
A cherry blossom commonly has five petals, so we place copies of the petal at intervals of 72° (= 360° ÷ 5). For a rotation by angle θ around the origin, use:
x' = x cosθ - y sinθ
y' = x sinθ + y cosθ
For 72°, θ = 2π / 5 ≈ 1.256637, cos(72°) ≈ 0.3090, and sin(72°) ≈ 0.9511.
x' = 0.3090x - 0.9511y
y' = 0.9511x + 0.3090y
Repeat the transformation for 72°, 144°, 216°, and 288° to arrange all five petals.
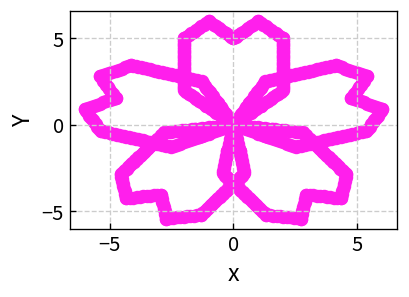
How to Draw It in Sakura Chart
- Calculate the X-Y coordinates for one petal.
- Use the rotation formula to create four additional petals.
- Assign a different LEVEL value to each petal.
- Combine all coordinates in one CSV file.
- Paste the data into Sakura Chart and create a scatter plot or line chart.
A separate LEVEL for each petal also lets you give the petals different colors.

Other Shapes You Can Create
The same approach works for stars, leaves, logos, and geometric patterns. Once a shape is represented as data, it can be reproduced in Sakura Chart, Excel, Matplotlib, or R, and its color, transparency, and scale can be adjusted freely.
Part 2: Why a Dog Is Harder to Draw
Next, we tried to represent a dog with the same X-Y-LEVEL structure. Unlike a flower, a dog's outline does not follow a small set of simple geometric rules.
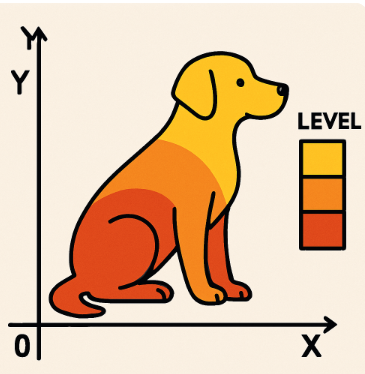
Asking for a Dog Produced an Ordinary Image
We asked ChatGPT to create three-column coordinate data that would form a dog. Instead, it returned a polished dog illustration. We then tried to use that image as the basis for generating points.
Plotting the Image Produced a Mysterious Creature
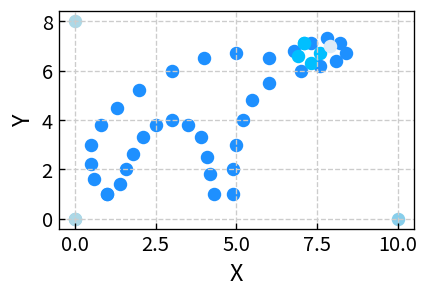
Plotting the generated points as a scatter plot preserved only a rough outline. The result was difficult to recognize as a dog because the important features were not selected or connected effectively.
Extracting Contours with Python and OpenCV
We also tried extracting the outline automatically:
- Convert the dog image to grayscale.
- Emphasize edges through edge detection or thresholding.
- Extract the contour as a sequence of X-Y points.
- Export the points to CSV and load them into Sakura Chart.
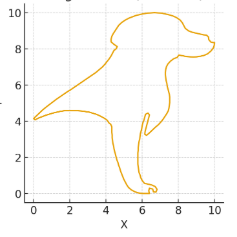
Too many points turned the chart into a dark mass, while reducing the number of points made the outline jagged. It was also difficult to decide where one LEVEL group should end and another should begin.
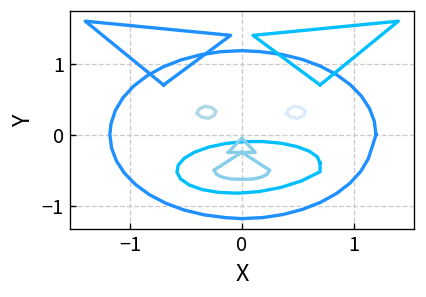
Focusing on the Face Finally Worked
Instead of drawing the entire body, we reduced the subject to the face. We selected only a few dozen points for the face outline, ear tips, eyes, nose, and mouth, then assigned X, Y, and LEVEL values to those features.
What the Dog Experiment Taught Us
- A general request for dog coordinates does not reliably produce useful point data.
- Raw contour extraction creates too many points for a clean chart.
- A limited subject, such as the face, is easier to simplify than the full body.
- Human judgment is still needed to select the features that make the subject recognizable.
Part 3: Where Coordinate Art Works—and Where It Struggles
Why the Cherry Blossom Was Easier
- Symmetry and rotation describe the shape with clear rules.
- A few straight lines can suggest a convincing petal.
- The drawing requires relatively few points.
Why the Dog Was Difficult
- A smooth natural outline requires many points.
- Recognizable features such as the ears, eyes, and nose must be selected deliberately.
- The most useful LEVEL boundaries depend on the subject and cannot be determined mechanically.
Sakura Chart is not primarily an illustration tool. This experiment instead shows how much thought is involved in reducing a visual subject to structured data—and how geometry, simplification, and feature selection affect the result.
Back to the cherry blossom
Back to the dog
Return to Sakura Chart