Free Fall with Initial Velocity: What Changes When an Object Is Thrown Downward?
Free fall often brings to mind an object simply released from rest. Another important case begins with the object already moving downward. This article compares release from rest with downward initial velocities of 5 m/s and 10 m/s.
We assume ideal motion without air resistance and use velocity-time and distance-time charts to separate what changes from what remains the same.
1. Assumptions
- There is no air resistance.
- The object's shape and size are ignored.
- Gravitational acceleration is constant.
- The positive direction is vertically downward.
These ideal conditions isolate the basic structure of accelerated motion.
2. Equations for Downward Motion
An object thrown downward starts with an initial velocity v0:
v(t) = v0 + g t
x(t) = v0 t + (1/2) g t²
Changing v0 changes the starting speed, but it does not change gravitational acceleration
g. Throwing harder does not make gravity stronger.
3. Speed and Acceleration Are Different
- The object thrown downward moves faster than one released from rest: true.
- The thrown object has greater gravitational acceleration: false.
The cases v0 = 0, v0 = 5 m/s, and v0 = 10 m/s all gain the same amount of
velocity each second. They simply begin at different speeds.
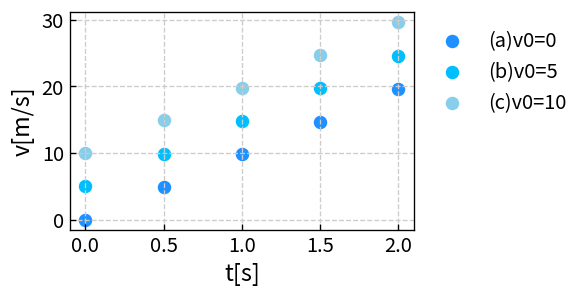
4. The Velocity-Time Graph
- Every series is a straight line.
- Every line has the same slope,
g. - A larger initial velocity shifts the line upward.
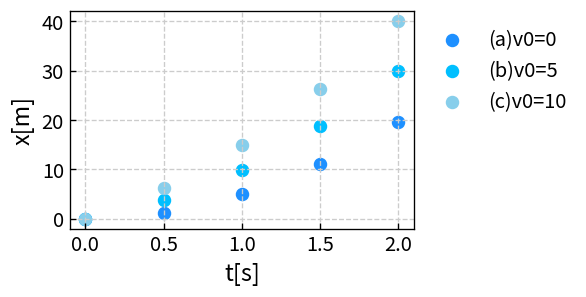
5. The Distance-Time Graph
Distance is quadratic in time, so each series is a parabola. The curves have the same quadratic term, but a larger
initial velocity adds more distance through the term v0 t.
6. Why the Gap Does Not Disappear
Because all objects have the same acceleration, their velocity differences remain constant. The faster object therefore continues to cover more distance. On the velocity graph this appears as parallel lines; on the distance graph it appears as separated parabolas.
7. Sakura Chart Settings
- X axis:
t[s] - Y axis:
v[m/s]for velocity orx[m]for distance - LEVEL:
LEVEL, which identifiesv0
Use the same CSV and change only the Y axis to compare the straight lines with the parabolas.
8. Copy the Sample CSV
The dataset contains all three initial velocities and can be pasted directly into Sakura Chart.
Summary
- Initial velocity changes the starting speed, not gravitational acceleration.
- Velocity-time graphs are parallel straight lines.
- Distance-time graphs are parabolas separated by the initial-velocity term.
- Speed and acceleration describe different aspects of motion.
Open Sakura Chart and try switching the Y axis between velocity and distance.